PLOTING DATA DENGAN MENGGUNAKAN Python 3.3.2
Oleh :
Dharma Adi Putra (1215031020)
(Kelas B)
Jurusan Teknik Elektro
Fakultas Teknik
Universitas Lampung
2013
Data yang Digunakan :

Syntax dari Phython 3.3.2 :
import numpy as np
import numpy as np
import matplotlib.pyplot as plt
N = 7
N = 7
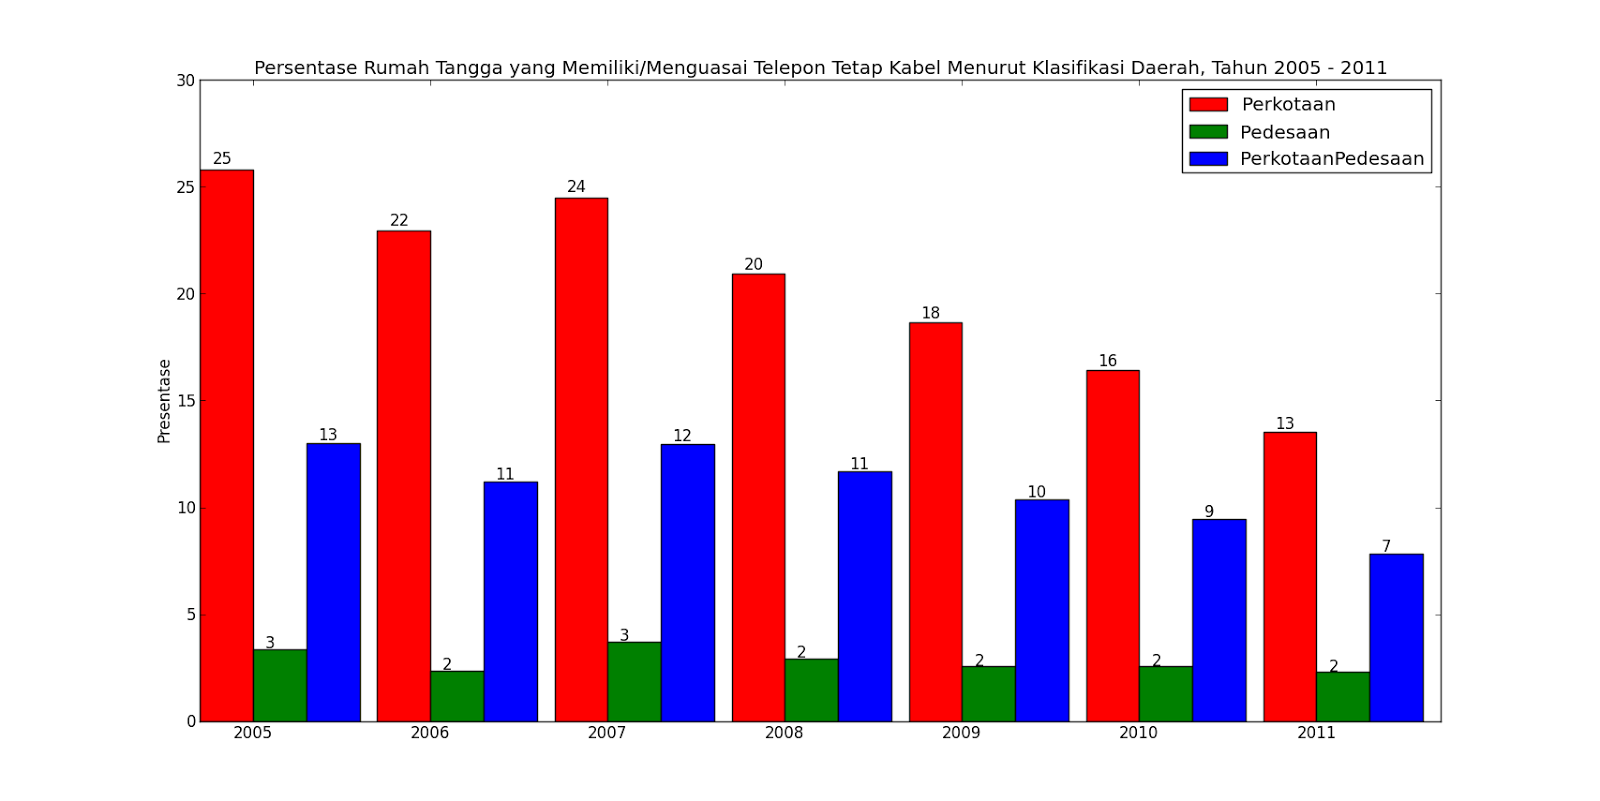
perkotaanMeans = (25.80, 22.95, 24.51, 20.93, 18.65, 16.43, 13.51 )
ind = np.arange(N) # the x locations for the groups
width = 0.3 # the width of the bars
plt.subplot(111)
rects1 = plt.bar(ind, perkotaanMeans, width,
color='r',
error_kw=dict(elinewidth=5, ecolor='pink'))
pedesaanMeans = (3.37, 2.35, 3.72, 2.91, 2.56, 2.56, 2.30)
rects2 = plt.bar(ind+width, pedesaanMeans, width,
color='g',
error_kw=dict(elinewidth=5, ecolor='yellow'))
PerkotaanPedesaanMeans = (13.01, 11.20, 12.96, 11.67, 10.36, 9.46, 7.85)
rects3 = plt.bar(ind+width+width, PerkotaanPedesaanMeans, width,
color='b',
error_kw=dict(elinewidth=5, ecolor='yellow'))
# add some
plt.ylabel('Presentase')
plt.title('Persentase Rumah Tangga yang Memiliki/Menguasai Telepon Tetap Kabel Menurut Klasifikasi Daerah, Tahun 2005 - 2011')
plt.xticks(ind+width, ('2005', '2006', '2007', '2008', '2009', '2010', '2011') )
plt.legend( (rects1[0], rects2[0], rects3[0]), ('Perkotaan ', 'Pedesaan', 'PerkotaanPedesaan',) )
def autolabel(rects):
# attach some text labels
for rect in rects:
height = rect.get_height()
plt.text(rect.get_x()+rect.get_width()/4., 1.01*height, '%d'%int(height),
ha='left', va='bottom')
autolabel(rects1)
autolabel(rects2)
autolabel(rects3)
plt.show()
Berikut adalah tampilan dari poting data dengan menggunakan phyton 3.3.2 :
Tidak ada komentar:
Posting Komentar